Great British Cake Sort
What can cake teach us about card sorting and taxonomy? Recently the CDL team got to talking about cake. Us being us, the conversation quickly turned technical. What are the categories of cakes, desserts and other sweet treats? So we decided to find out the best way we know how – user research.
We set up an online card sort. Over 160 of you answered the call and sorted sweets, chocolate, tarts and jellies into categories for us. In this blog post we’re going to use this example to show you how:
- to run a card sort,
- you can use the results to classify and categorise things (create taxonomies) in a way that matches your users’ mental model,
- to use your categories to improve navigation and information architecture.
Just tell me the results!
Before I get into the useful technical stuff, I know you just want to hear what our study told us.
The categories
After looking carefully at the data, we decided on 7 categories of dessert and other sweet things:
- sweets and chocolate,
- ice cream and sorbet,
- jelly and mousse,
- puddings,
- tarts and pies,
- cakes and pastries,
- biscuits.
There are always some choices about how to interpret the data. For example, according to our users, tarts and pies are quite closely related to cakes and pastries. We could have put them all in one big group. But on balance, we thought tarts and pies worked better as a separate category.
Relationships between categories
There’s more in the data than just raw categories. It also told us something about the relationship between categories. It turns out our dessert mental model isn’t flat, it’s a triangular pyramid shape. 4 of our 7 categories are at the points, and 3 lie on the edges. Like this (with apologies for my sketching skills):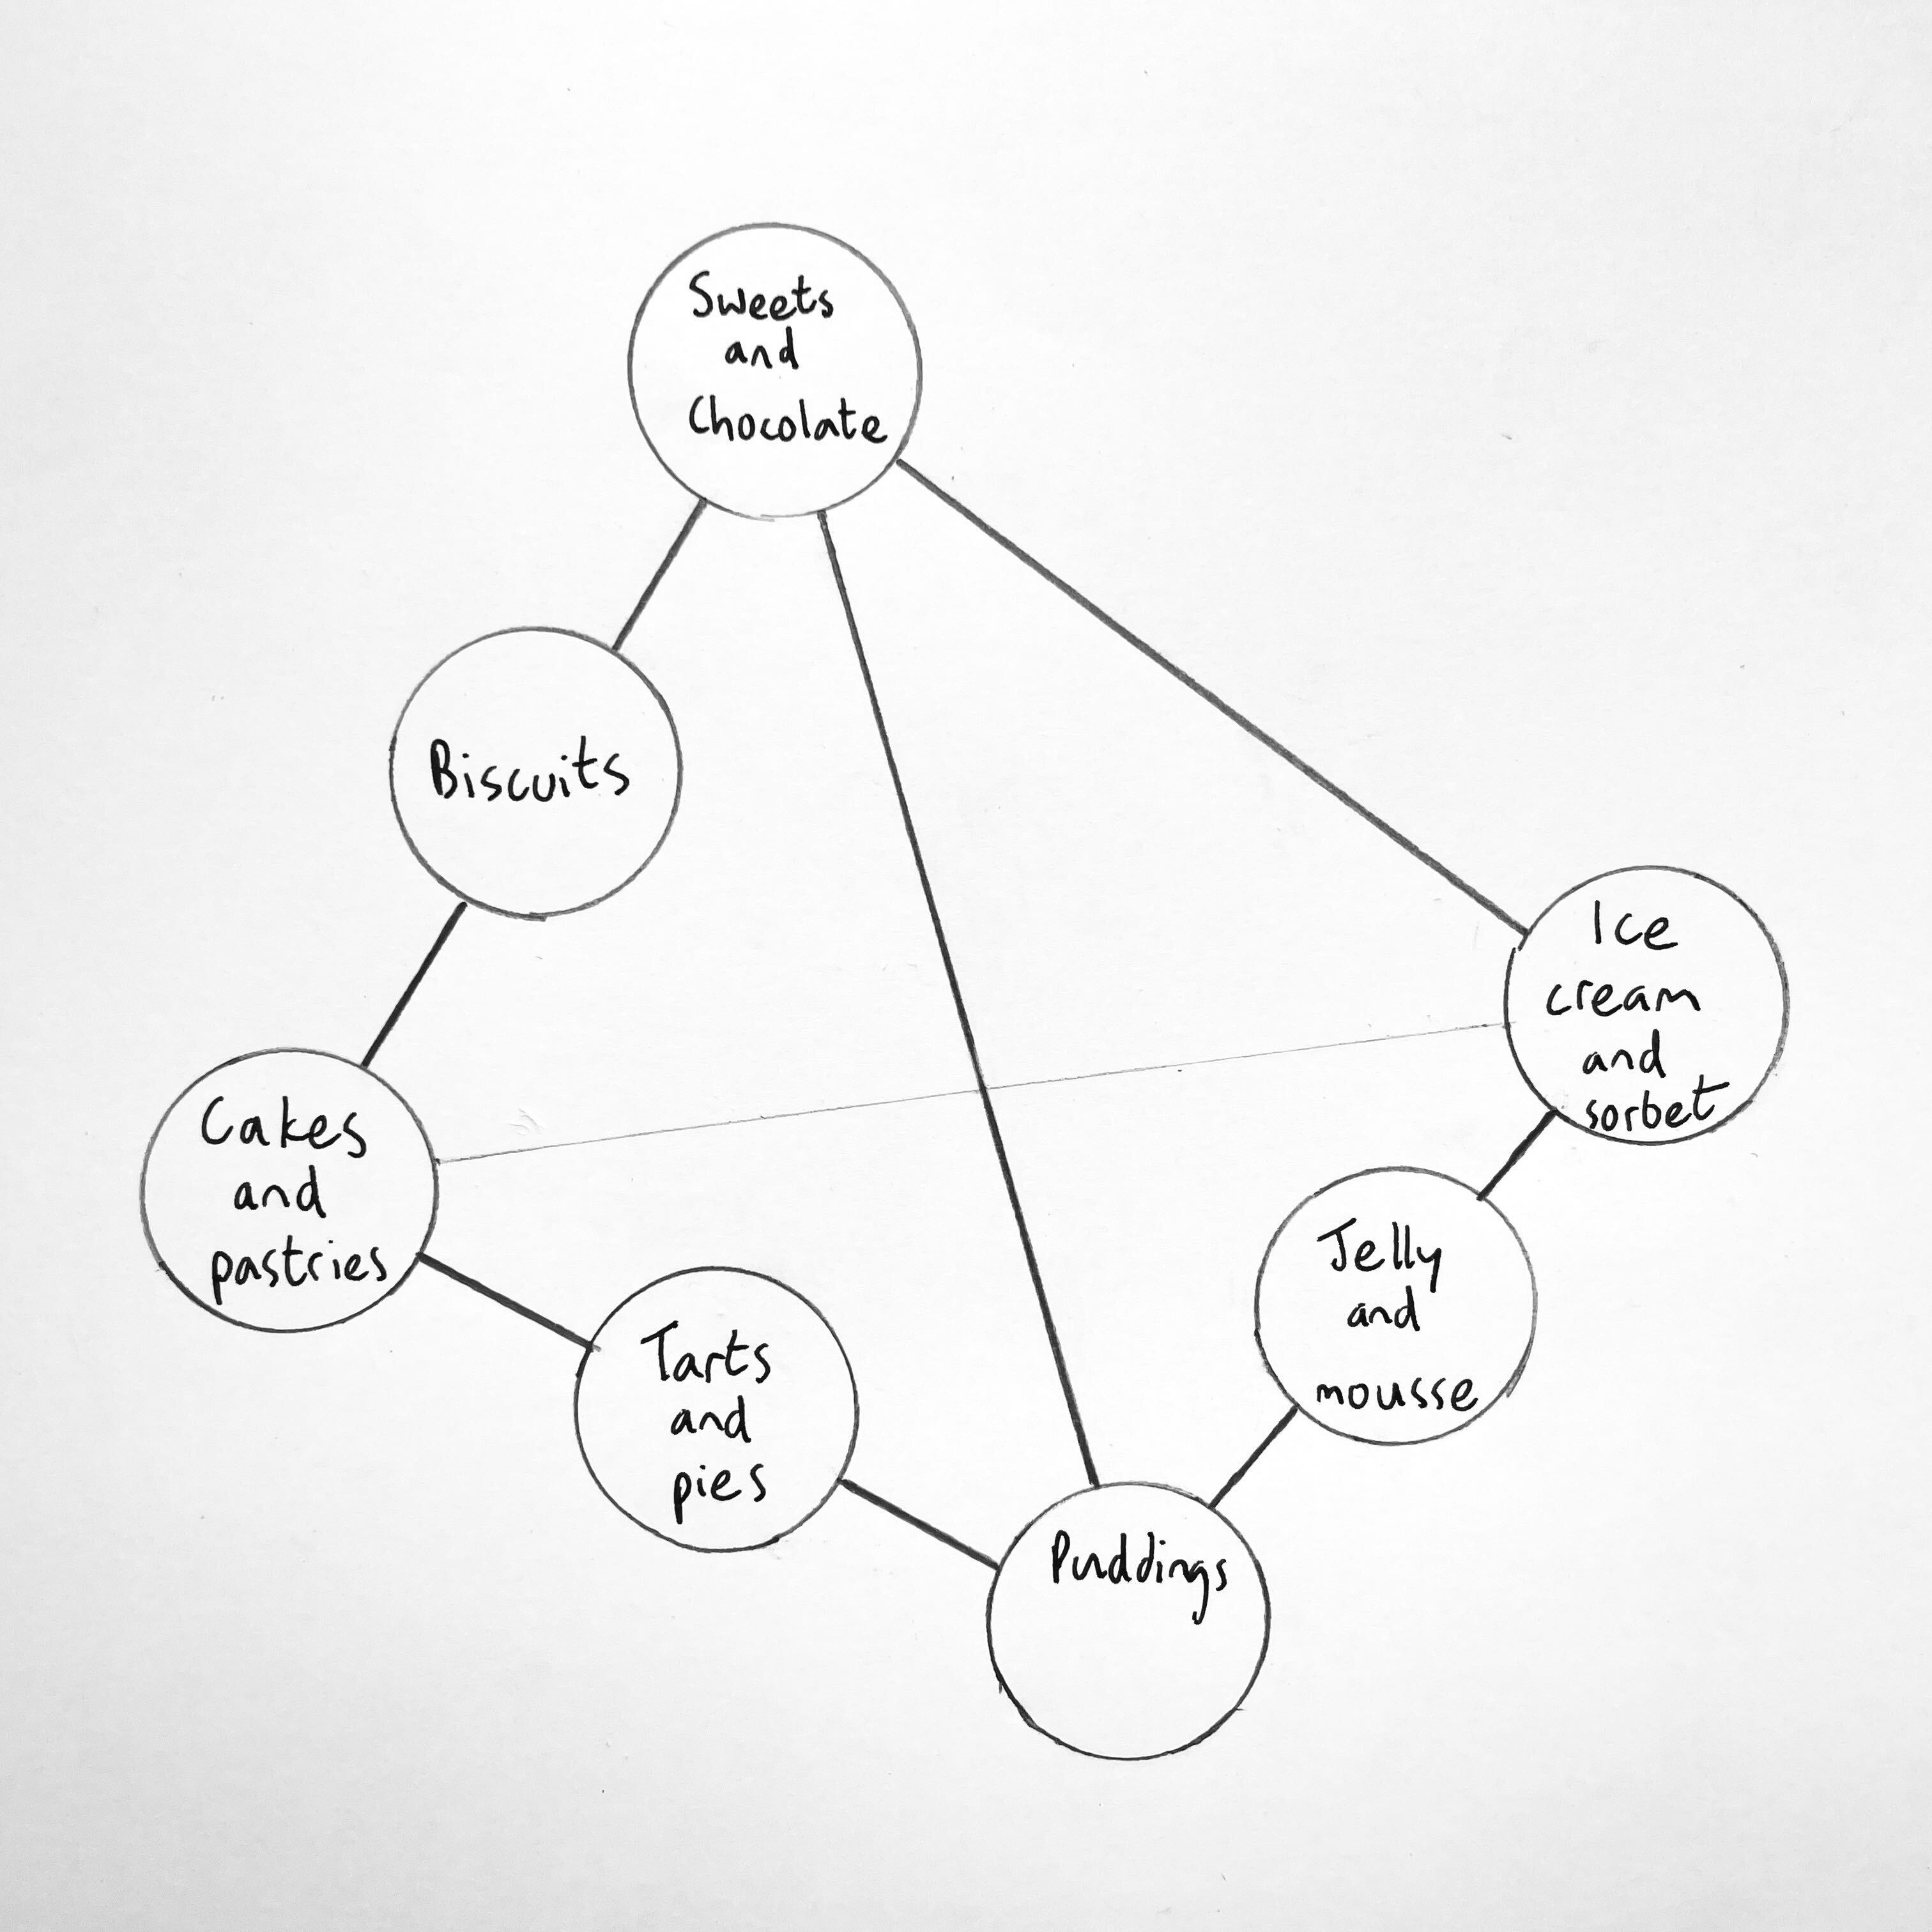 We’re sure there’s something to be outraged about for everyone in this model. Personally I think jelly and mousse are types of pudding. But the data says what the data says. It looks like enough of you have childhood associations between jelly and ice cream that it sits between ice cream and pudding.
Comedy categories
The categories we’ve chosen emerge from over 160 people’s groupings. They should match many people’s mental models, reasonably well, much of the time.
But it’s fun to look closer at the data, and see some of the oddball categories individual people chose to match their personal mental model. Here are some of our favourites:
- Grandma things,
- A treat to take the edge off (the edge off what we wonder?),
- Absolutely cake,
- Absolutely not cake,
- Cake-adjacent,
- Horrible,
- No to these.
How to do a card sort
So how did we get there? What is card sorting and how do you analyse the results?
You can run a card sort in person using real cards, or online using a virtual whiteboard or dedicated card sorting software.
Write down each thing you’d like to categorise on a card, one card per item. Then ask your users to take each card and put it into a group.
In person
If you’re running a card sort in person, write each item down on an actual piece of card, or a Post-it note.
Invite people into the room with you one at a time, and ask them to sort items into groups physically, on a table or by sticking them to the wall. Give them some way to label their groups (if you’re running an open or hybrid card sort).
At the end you’ll need to take a good picture of their groups, so you can analyse the results later.
Online
For our card sort we used an online tool called Optimal Sort, which is part of the Optimal Workshop suite of user testing tools. We promise we’re not on commission – we just like it.
Open
In an open card sort you don’t give users any categories to sort items into. They choose and label their own categories. I find this useful at the beginning of a piece of work, when I don’t know anything about people’s mental models.
Closed
In a closed card sort you give users all the categories and ask them to sort the items into only those categories. I find this useful after I’ve got a hypothesis about peoples mental model (perhaps from a previous open card sort) and I want to see if it really works.
Hybrid
In a hybrid card sort you give people some categories, but also let them make and label their own. Use it in the same situations as a closed sort, but when you still want to give users a little freedom, or you think you may have missed some categories.
Cultural considerations
You need to take culture and vocabulary into account when you’re setting up a card sort. Will all your target users have a shared basic vocabulary, or do you need to cater for different dialects?
In our dessert study, we tried to label items in both British and North American English, for example jelly and jello.
Your results might be culturally dependent too. If we ran this study in French, we suspect pastries may not be in the same category as cakes.
In this case, it seems many of our mainly British audience hadn’t heard of things like Japanese mochi and Indian barfi.
Interpreting the results
For a physical card sort you’ll need to do the work to analyse the results yourself.
To analyse the results of a card sort, look for:
- categories that lots of users create,
- things they consistently sort into the same category,
- things that frequently get paired together in the same category.
One of the reasons we use Optimal Sort is that it does the heavy lifting for you.
Optimal sort offers you several views of your data, like a similarity matrix, which shows you how often pairs of cards are sorted together.
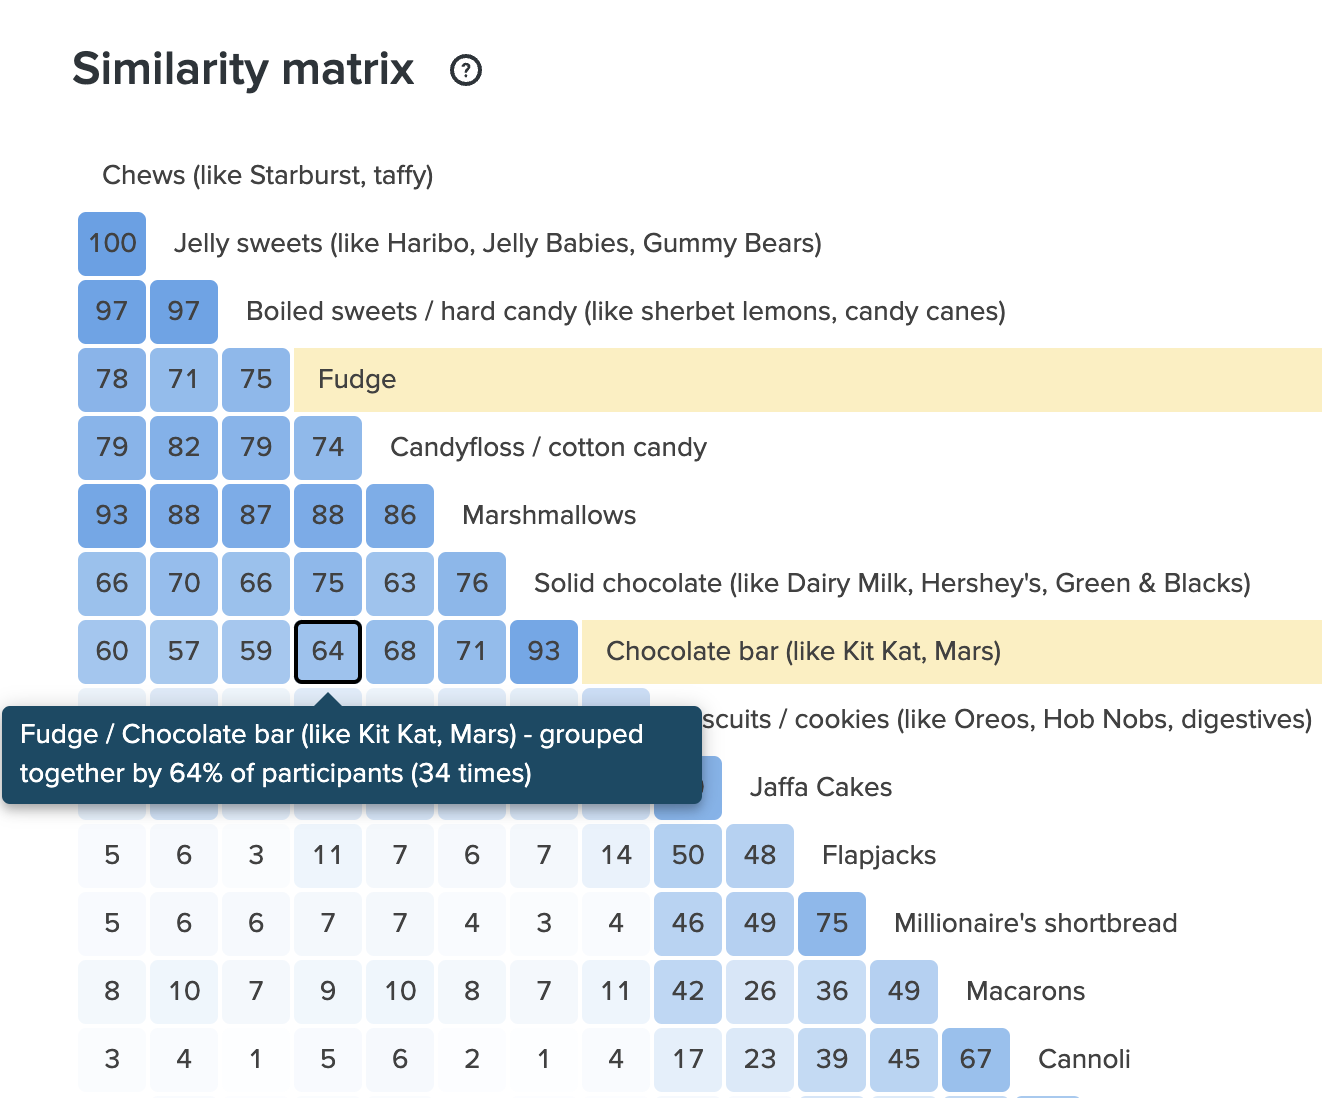 In our study, fudge was 64% like a chocolate bar.
My personal favourite is the 3D Cluster View. This represents the strength of connections between items as distance in space, and shows clusters of items in the same colour.
Here’s our model in the 3D Cluster View:
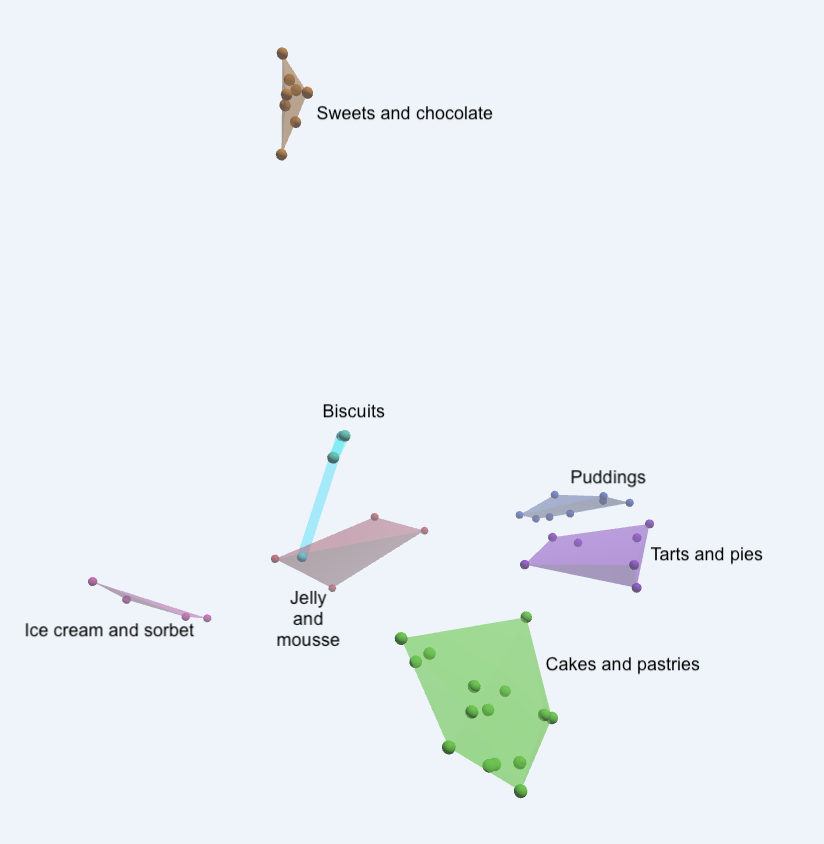 In this 3D Cluster View:
- brown = sweets and chocolate,
- pink = ice cream and sorbet,
- green = cakes and pastries,
- dark blue = puddings,
- purple = tarts and pies,
- red = jelly and mousse,
- light blue = biscuits.
In Optimal Sort you can:
- rotate the 3D model to see how different groups relate to each other,
- see which items are in each cluster,
- try out different groupings, by breaking groups apart or joining groups together.
Using the results
So what is all this for, apart from fun? You can use your new understanding of how people group things (taxonomy) to organise your content (information architecture).
You can:
- design navigational menus or decision trees,
- create metadata tags for search and other uses,
- write content about different groups of things.
In our example, you might use this information to organise items in an online grocery shop or recipe website, create an index for a cookbook, or even arrange the shelves in a supermarket.
If we’re using card sort results to create a navigational system, the next step might be to run a tree test. We’ll write about tree testing in a future post!
Recommended reading
Everyday Information Architecture, Lisa Maria Marquis